GPT Image 2
Crime Falls, Fear Rises
{
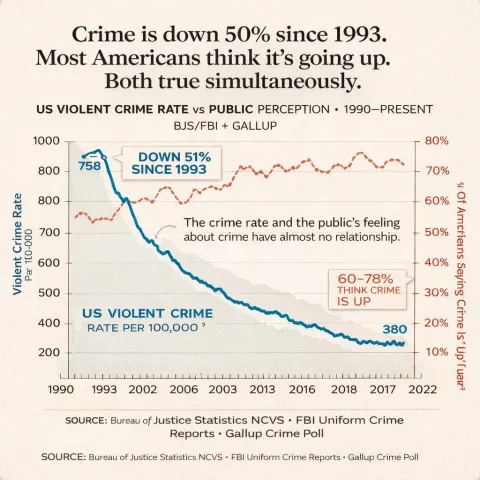
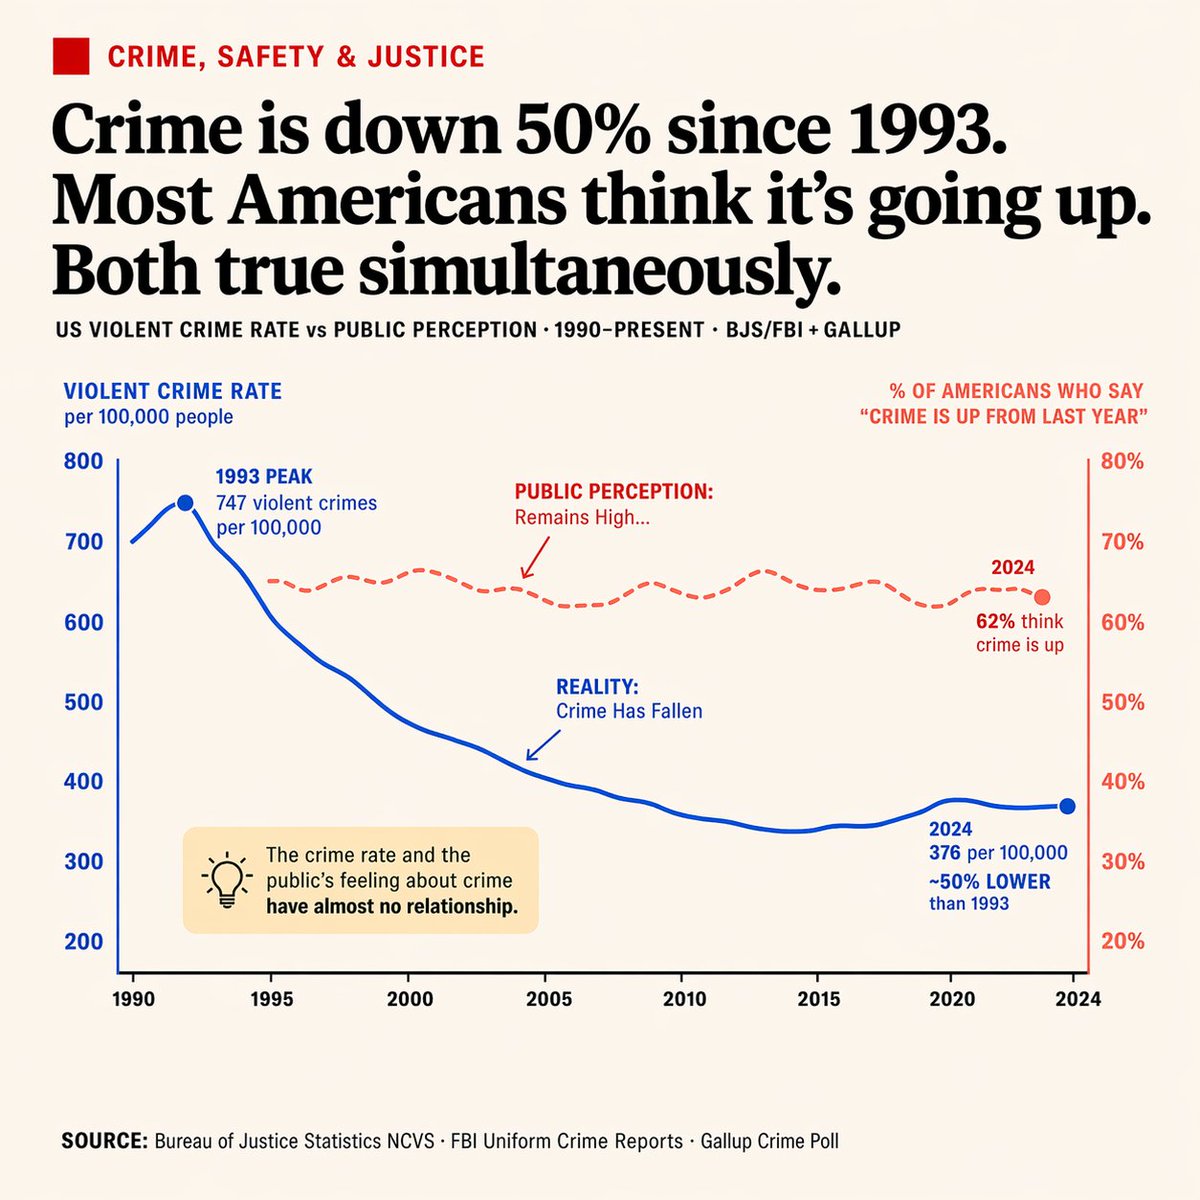
 "type": "editorial infographic dual-axis line chart",
 "style": "clean, newspaper-style, off-white background, highly legible typography",
 "header": {
 "category": "CRIME, SAFETY & JUSTICE (red text with red square icon)",
 "headline": "Crime is down 50% since 1993. Most Americans think it's going up. Both true simultaneously.\",
 "sub_headline": "US VIOLENT CRIME RATE vs PUBLIC PERCEPTION · 1990-PRESENT · BJS/FBI + GALLUP"
 },
 "chart": {
 "x_axis": "Years 1990 to 2024 with 8 tick marks",
 "left_y_axis": {
 "color": "blue",
 "label": "VIOLENT CRIME RATE per 100,000 people\",
 "range": "200 to 800"
 },
 "right_y_axis": {
 "color": "red",
 "label": "% OF AMERICANS WHO SAY 'CRIME IS UP FROM LAST YEAR'\",
 "range": "20% to 80%"
 },
 "data_series": [
 {
 "name": "Reality",
 "style": "solid blue line",
 "trend": "peaks early then drops significantly",
 "annotations": [
 "1993 PEAK 747 violent crimes per 100,000 (with blue dot)",
 "REALITY: Crime Has Fallen (with blue arrow pointing to line)",
 "2024 376 per 100,000 ~50% LOWER than 1993 (with blue dot)"
 ]
 },
 {
 "name": "Public Perception",
 "style": "dashed red line",
 "trend": "remains relatively flat and high",
 "annotations": [
 "PUBLIC PERCEPTION: Remains High... (with red arrow pointing to line)",
 "2024 62% think crime is up (with red dot)"
 ]
 }
 ]
 },
 "callout_box": {
 "position": "bottom left inside chart area",
 "style": "light yellow rectangle",
 "icon": "lightbulb",
 "text": "The crime rate and the public's feeling about crime have almost no relationship.\"
 },
 "footer": {
 "text": "SOURCE: Bureau of Justice Statistics NCVS · FBI Uniform Crime Reports · Gallup Crime Poll\"
 }
}