GPT Image
Analytics Dashboard Transformation
Title: Create a vertical 4:5 (1080x1350) mixed-style visual: bus...

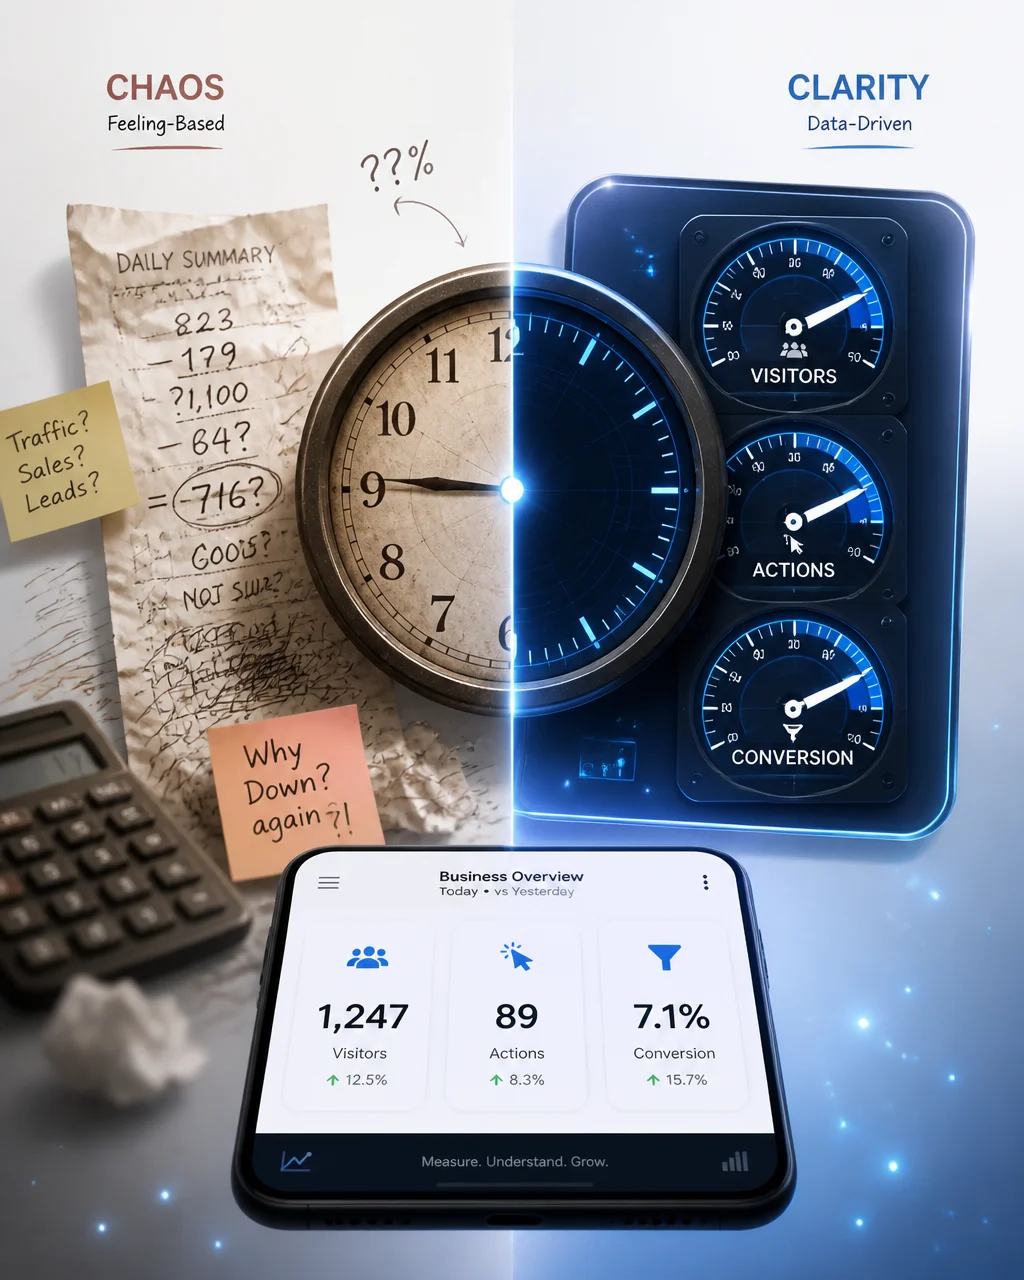
Prompt: Create a vertical 4:5 (1080x1350) mixed-style visual: business analytics dashboard transformation. Split composition showing left side (messy/chaotic) vs right side (clean/structured).

Background: Light gradient from #FAFAFA (top) to #E8F0FE (bottom), with subtle glowing blue particles floating upward like data points. Soft radial glow in the center.

Visual metaphor — Split Clock (Dashboard vs Chaos):
Left side: A crumpled receipt with scribbled numbers, scattered sticky notes, and a blurry calculator — representing "feeling-based" business. Colors: muted warm tones. A small "??%" hovering.

Right side: A sleek aircraft instrument panel reimagined as a business dashboard — three analog gauges labeled "Visitors", "Actions", "Conversion" all pointing to optimal ranges. Blue digital glow. Clean glass panels. Colors: #2563EB accent, white, #0F172A.

Bottom third: A single modern smartphone floating, showing a simplified analytics screen — just 3 big numbers: "1,247", "89", "7.1%". Small dark navy (#0F172A) footer area.

Style: Clean editorial illustration mixed with cinematic depth of field. Soft volumetric lighting from upper right. Glassmorphism on the dashboard elements. Mood: professional, insightful, calm authority.