GPT Image 2
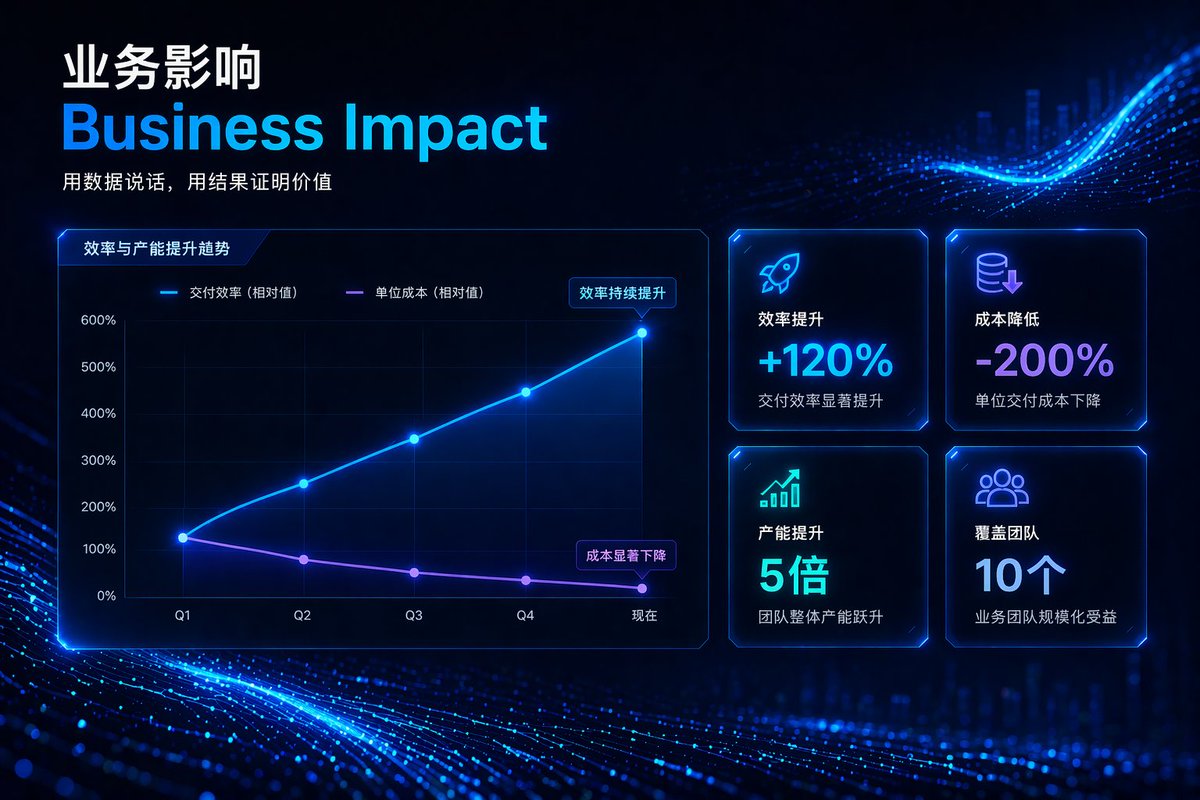
Business Impact Data Dashboard
{
 "type": "corporate presentation slide",
 "theme": "high-tech, futuristic, dark mode, glowing neon blue and purple accents, abstract digital particle wave background",
 "header": {
 "title_primary": "Business Impact\",
 "title_secondary": "Business Impact\",
 "tagline": "Let the data speak, the results prove value\"
 },
 "layout": {
 "left_section": {
 "type": "line chart",
 "title": "Efficiency and Capacity Improvement Trends",
 "y_axis": ["0%", "100%", "200%", "300%", "400%", "500%", "600%"],
 "x_axis": ["Q1", "Q2", "Q3", "Q4", "Now"],
 "lines": [
 {
 "label": "Delivery Efficiency (Relative)",
 "color": "neon blue",
 "trend": "upward curve",
 "annotation": "Efficiency continues to improve"
 },
 {
 "label": "Unit Cost (Relative Value)",
 "color": "neon purple",
 "trend": "downward curve",
 "annotation": "Significant cost reduction"
 }
 ]
 },
 "right_section": {
 "type": "kpi grid",
 "count": 4,
 "arrangement": "2x2 grid",
 "cards": [
 {
 "icon": "rocket",
 "title": "Efficiency Improvement",
 "value": "+120%\",
 "subtext": "Significantly improved delivery efficiency"
 },
 {
 "icon": "coins with down arrow",
 "title": "Cost Reduction",
 "value": "-200%\",
 "subtext": "Unit delivery cost is decreasing"
 },
 {
 "icon": "bar chart with up arrow",
 "title": "Capacity Enhancement",
 "value": "5x",
 "subtext": "Overall team capacity spurt"
 },
 {
 "icon": "people group",
 "title": "Coverage Team",
 "value": "10 pieces",
 "subtext": "Business Teams Benefit from Scaling"
 }
 ]
 }
 }
}